If you're looking to monitor system performance and manage processes on your Ubuntu machine, htop is an invaluable tool. This interactive process viewer offers a more user-friendly and visually appealing interface compared to the traditional top command. In this article, we’ll explore what htop is, how to install it, its features, and how to navigate its interface effectively.
What is htop?
htop is an interactive process viewer for Unix-like systems, including Ubuntu. It provides real-time information about system processes, CPU usage, memory consumption, and more, all in a colorful and easy-to-read format. Unlike top, htop allows users to interactively manage processes, making it a favorite among system administrators and power users.
Installing htop on Ubuntu
Before you can use htop, you need to install it. Follow these simple steps:
-
Open your terminal.
-
Update your package list:
sudo apt update -
Install
htop:sudo apt install htop
Once installed, you can launch htop by typing htop in the terminal.
Navigating the htop Interface
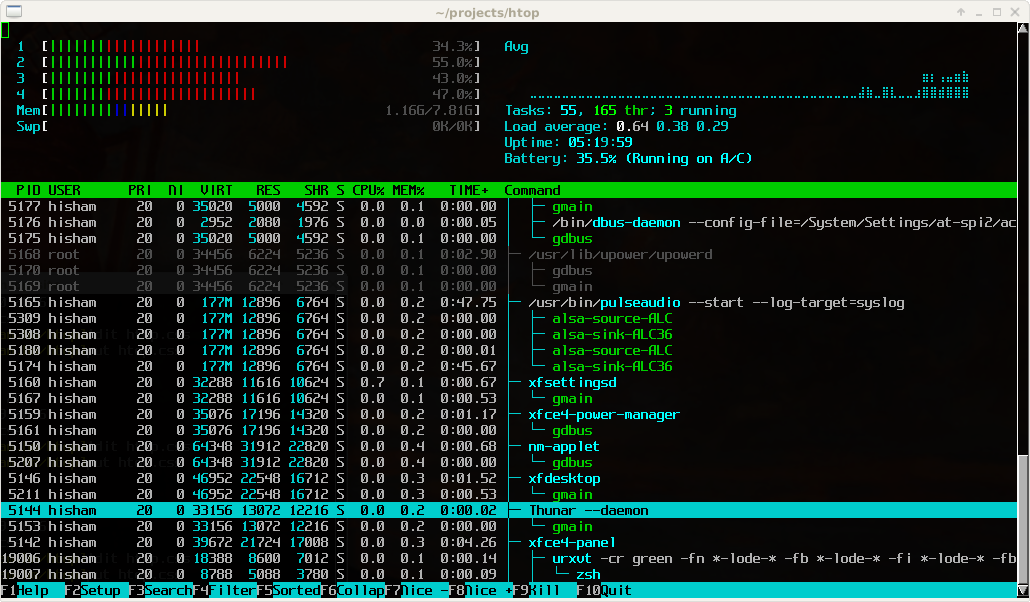
When you start htop, you'll be greeted with a colorful display that consists of a header, a process list, and a footer.
The Header
The header provides a quick overview of your system's resource usage:

- CPU Usage: Displays the usage of each CPU core with color-coded bars indicating:
- Green: User processes
- Red: System processes
- Blue: Nice processes (lower priority)
- Orange: I/O wait
- Light blue: Steal time
- Gray: Idle time
- Memory Usage: Shows total, used, and free memory, along with buffers and cache. It typically displays:
- Total memory
- Used memory
- Free memory
- Buffers and cache memory
- Swap Usage: Similar to memory usage, but for swap space, indicating how much swap space is used and how much is free.
- Load Average: Displays the system load averages for the last 1, 5, and 15 minutes, indicating how many processes are actively competing for CPU time.
- Uptime: Shows how long the system has been running since the last boot.
The Process List
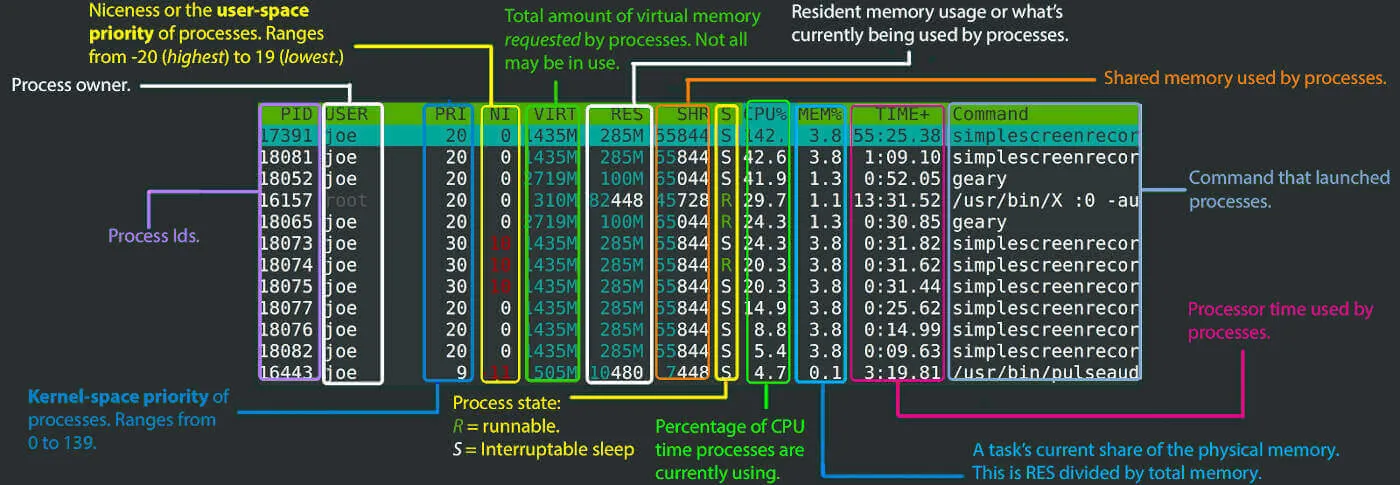
Below the header, you'll find a list of running processes, including details such as:

- PID: Process ID
- USER: The user who owns the process
- PR: Priority of the process
- NI: Nice value (affects scheduling priority)
- VIRT: Virtual memory used by the process
- RES: Resident memory (physical memory used)
- SHR: Shared memory
- S: Process status (e.g., S for sleeping, R for running)
- %CPU: CPU usage percentage
- %MEM: Memory usage percentage
- TIME+: Total CPU time used by the process
- COMMAND: The command that started the process
The Footer
The footer contains function keys that allow you to perform various actions:

- F1 - Help: Access the help menu for guidance on using
htop. - F2 - Setup: Configure display options and customize columns.
- F3 - Search: Search for a specific process by name.
- F4 - Filter: Filter processes based on criteria.
- F5 - Tree View: View processes in a hierarchical tree format, illustrating parent-child relationships.
- F6 - Sort By: Change the sorting order of the process list based on different columns (e.g., CPU, memory).
- F7 - Nice -: Decrease the "nice" value of the selected process, increasing its priority.
- F8 - Nice +: Increase the "nice" value of the selected process, decreasing its priority.
- F9 - Kill: Terminate a selected process. You can choose the signal to send (e.g., SIGTERM, SIGKILL).
- F10 - Quit: Exit
htop.
Customizing htop
One of the strengths of htop is its customization options. You can change the sorting order, filter processes, and adjust the columns displayed to focus on the information that matters most to you. To customize htop:
- Press F2 or Fn + F2 to enter the setup menu.
- Navigate through the options to adjust display settings,
- Display Options: In the setup menu, you can modify how information is displayed. You can choose which columns to show, change their order, and adjust the colors used in the interface for better visibility.
- Sorting Options: You can set default sorting preferences for the process list. This allows you to prioritize viewing processes based on CPU usage, memory consumption, or any other metric that is important to you.
- Tree View: If you prefer to see processes in a hierarchical format, you can toggle the tree view (F5). This view helps you understand the relationships between parent and child processes, making it easier to manage complex applications.
- Save Configuration: After making your desired changes, you can save your configuration so that it persists the next time you launch
htop.
Using htop Effectively
To make the most out of htop, consider the following tips:
- Monitor Resource Usage: Keep an eye on CPU and memory usage to identify any processes that are consuming excessive resources. This can help you troubleshoot performance issues.
- Manage Processes: Use the kill function (F9) to terminate unresponsive or resource-hogging processes. You can also adjust the priority of processes using the nice commands (F7 and F8) to optimize system performance.
- Search and Filter: Utilize the search (F3) and filter (F4) functions to quickly locate specific processes, especially in systems with many running applications.
- Regular Monitoring: Make it a habit to check
htopregularly, especially if you are running resource-intensive applications or services. This proactive approach can help you catch potential issues before they escalate.
Whether you're a system administrator, developer, or casual user, mastering htop can significantly improve your experience with Linux.
So, install htop today, explore its features, and take control of your system's performance!